Personal Dashboard
I wasn't thrilled with the preset capabilities of the Wink Nimbus, so I wrangled a few APIs together to get a glanceable view of local transit, the weather, and my finances. The code is available on github.
Origins
When I joined IFTTT, I got a number of "Internet of Things" devices to playtest with and familiarize myself with the space. One of the things I got was a Wink Nimbus, as it claimed to be a "highly customizable 4-dial dashboard that tracks what’s important to you," which seemed pretty neat. Plus, I liked the idea of a glanceable dashboard that I could look at without needing to pull out and unlock my phone.
It's a good piece of hardware, but when I was setting it up I found myself underwhelmed - many of the built-in integrations didn't seem particularly useful or novel (number of new tweets, eggs in your fridge, the current time), and the ones that did seem interesting didn't work particular well (next calendar appointment, traffic/commute times). I dug around on the internet and found that they had a semi-public API, so rather than just shelve the product, I decided to write the integrations that would be most useful for me.
About the Dashboard
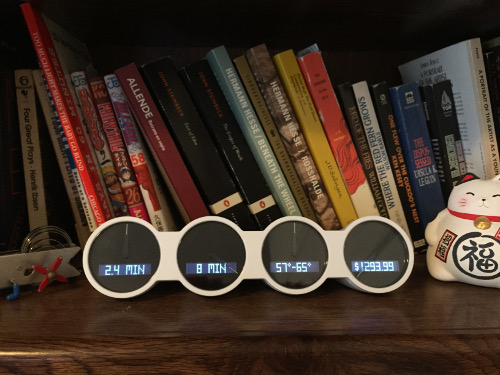
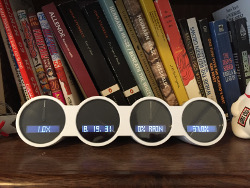
The nimbus has four gauges, each with a dial and a small ~8 character LED. You can also press on the top of the nimbus to access secondary text for each of the dials, which I used as a sort of "View More" functionality.
After some soul-searching to think of useful gauges and internet-searching to discover APIs that could source the information, I settled upon four things I wanted the dashboard to show:
- Uber: the text shows the current Uber wait time at my apartment, with the dial showing current surge — straight up/"12pm" is no surge, "3pm" is 1.25x, "6pm" is 1.5x, and "9pm" is 2x. Tapping on the dial brings up the secondary text which gives the exact surge amount.
- Muni: I will typically take the 45 bus when I don't ride my bike to work, so the text on this dial shows the time until the next bus at the bus spot near my apartment. The dial shows the amount of time until the bus after the next bus, so I know if I have to catch this one or if there will be one soon after. Tapping on the dial brings up the secondary text which gives the ETAs for the next 3 busses.
- Weather: Pretty simple, shows today's high-low as the text, with the gauge showing the chance of precipitation. The secondary text gives the exact chance of precipitation.
- Expenses: This dial shows me the amount I've spent in the last month, with the gauge showing the % of my monthly budget that I've gone through so far.
Here's the normal view and the alternate view, side by side:
Building the Dashboard
The first step was getting set up to write custom values to the Nimbus. Getting an API key takes a bit of back and forth with their support team, and once you do get an API key it takes some perseverance to get everything working correctly, as much of their documentation is out of date or unavailable. Feel free to use my python library to get started.
Once I was able to write custom text and values to the nimbus, I started plugging in APIs. Uber has a nice public API now, so that was a breeze. The Muni API is a bit clunkier to work with, but to be honest I was surprised that a municiple bus system would even have an API. The times it gives are nice and accurate, which is probably more important than whether it uses JSON vs XML.
For weather, I evaluated a few different sources, and ended up settling upon Darksky's Forecast.io API, as it had the easiest way of getting "human-friendly" temperatures and chance of precipitation.
The most trying task was figuring out how to get programmatic access to how much money I had spent in the last month. Banks have yet to jump on the API bandwagon, and Plaid didn't yet support my credit card provider. I ended up setting up a Mint account just so that I could use a screen-scraping Mint library someone wrote. Hacky, but it worked.
All the code for the dashboard is available on github - you'll just have to fill in all the various API keys and default parameters to customize it to where you live.
Reflections
Much like wearables, Internet of Things devices work best when they provide targeted, highly personalized value. While the default integrations didn't make the grade, the presence of an API meant that I could put in a little bit of elbow grease and make it useful for myself. Also, it took sitting down and really thinking about it to identify which pieces of information would actually be most useful to me - there are lots that might seem useful on the surface but aren't super valuable or are just downright annoying in a glanceable dashboard (for example number of unread emails). I would expect these two problems to be fairly universal with any dashboard-like IoT devices, which might explain why none of them have gotten much adoption.